Habitat for Humanity
Energy Report and Lifecycle Analysis
Research Project, January 2023

Habitat for Humanity: Energy Report and Life Cycle Analysis
Habitat For Humanity is an international Non-Governmental
Organization that is nonprofit that partners with communities
all over the world to help them build or improve a place they
call home. These homes built are traditionally Wood frame
construction for a multi-family living (two Families). These homes have a basement and a ground floor with
three bedrooms, a kitchen, family room, mud room, foyer, 1.5
baths, and a two-car garage.
This project serves as a comparison model for two different
types of construction. One being the traditional wood frame
houses that have always been built and a new
construction type that uses insulated concrete form (ICF)
as the envelope of the building.
The new construction (ICF) is a system of expanded
polystyrene (EPS) rigid insulation blocks separated by plastic
webbing. It is used as an integrated concrete form to pour a
concrete wall. These blocks come in interlocking sections, so a wall system fits tightly together. Once the blocks are
in place, concrete is poured and finishes like drywall and
siding are attached to fastener strips embedded in the
insulation. ICF blocks are advantageous because they seal
well preventing air leakage through the walls and it has two
continuous insulation layers, one outside, one inside with no
thermal bridges which reduced heat loss.
The chosen ways of comparison for the two constructions
were by Energy Modeling and by Life Cycle Analysis. This
document serves as a report for the Energy Modeling and Life Cycle Analysis for the two types of construction
being considered.
You will find
discussions here…
*
What if we could build a mile high?
*
What would it be like to live there?
*
How much energy would it take to build such a building, and where would the energy come from?
*
What drives people to think about building higher and, more importantly, is it even the right thing to do?
*
Alternatively, why do some people live in houses in the suburbs?
*
How do their choices of habitat impact the environment?

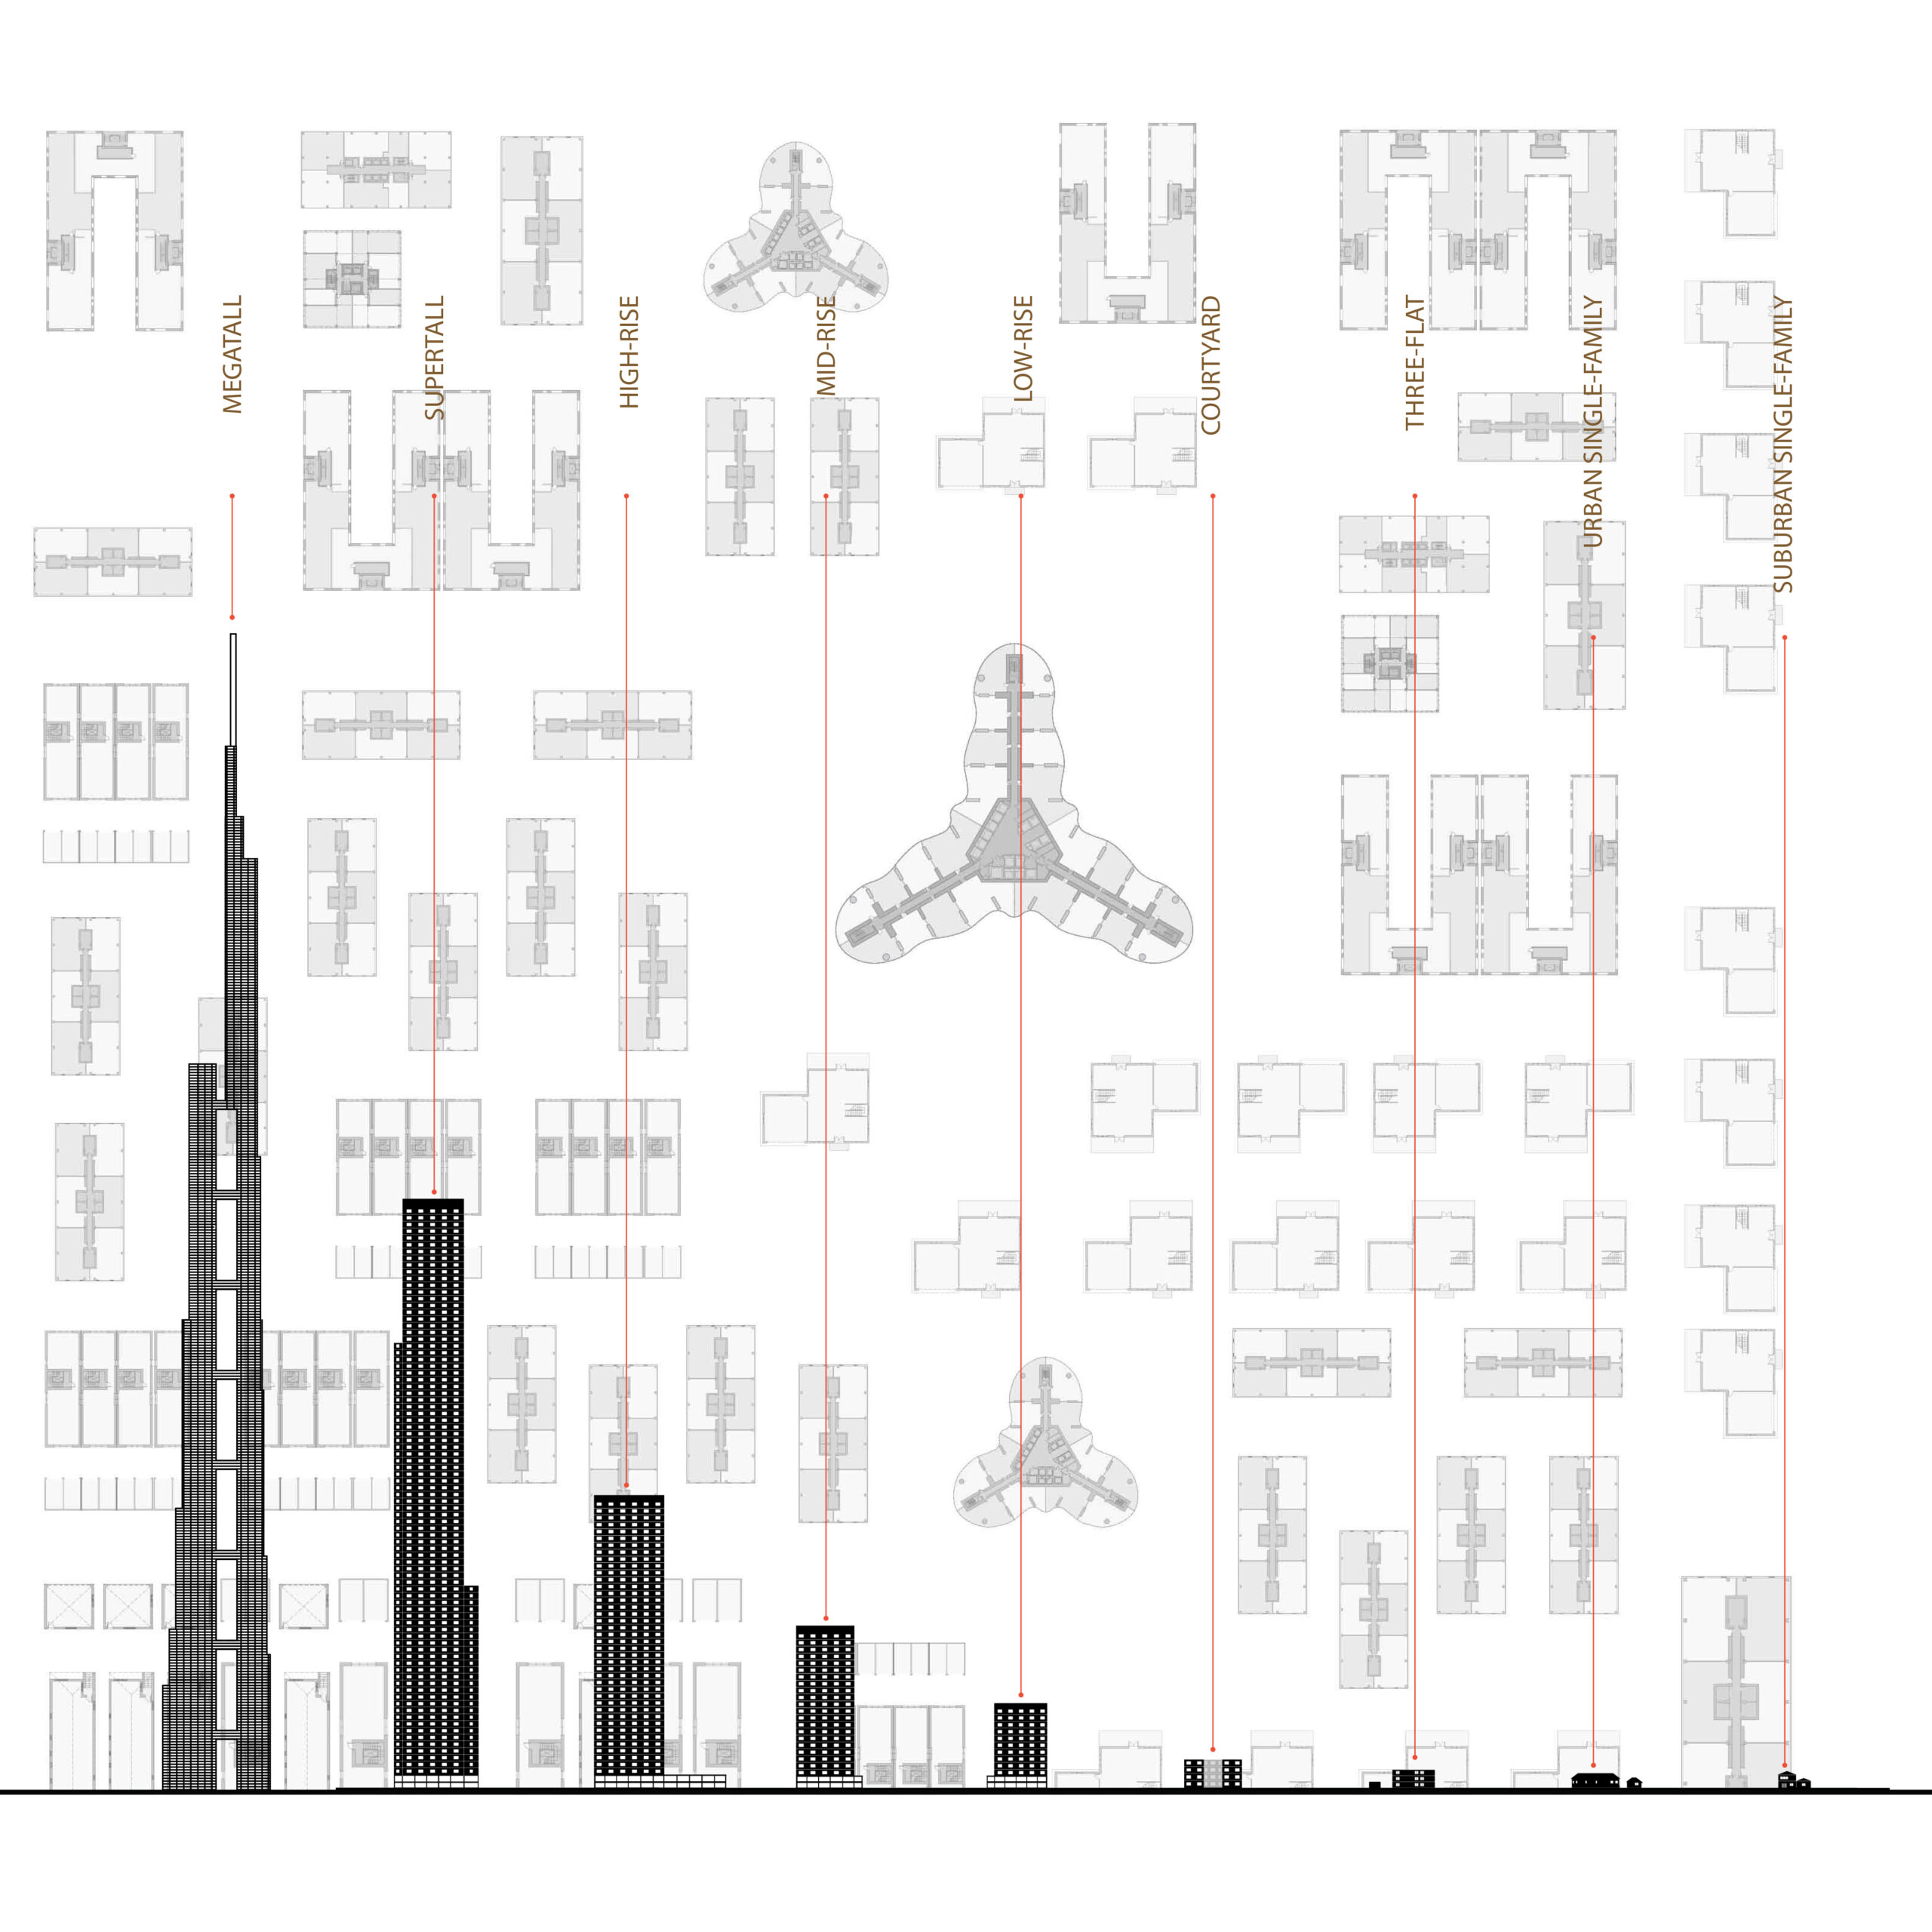
Typologies shows an examination and documentation of nine specific building prototypes that form the core of the analysis, describing the prototypes’ history, design in relation to the study, and key statistics about each type. To answer questions regarding comparisons between different building types or communities, each typology was first examined to ensure relevancy.
Typologies from Megatall to Single-Family
We developed a robust study methodology with boundaries and assumptions that could be applied equally to low- and high-density communities. We chose communities of 2000 residential units, with an average unit size of 150 m2 net residential area, as the prototypes and ASHRAE climate zone 5A as the location. Nine prototypical buildings were designed – Megatall, Supertall, High-Rise, Mid-Rise, Low-rise, Courtyard, Three-Flat, Urban Single-Family, and Suburban Single-Family – set within nine prototypical communities. The study designates an archetypal residential community of 2,000 units with an average unit size of 150 sm as a reasonable and representative cross-section of different housing typologies.
Land Use
Although it has changed considerably through the ages, the development, spread, and expansion of cities is not a recent phenomenon. Ancient cities grew to defend groups of people or protect valuable land; others were strategically built along trade routes or shipping ports. If a city’s population continually expands it needs to adapt by creating areas of increased density and improved transportation.
The development of open land has historically impacted the human condition. Land use is an acute issue in western nations, such as the United Kingdom and Japan, and can be even more critical in newly industrialized and developing nations where there is an opportunity to learn from earlier trends. But the United States continues to serve as an interesting example of urban development at a relatively young age.
Energy
The energy chapter is a technical assessment of the energy-consumption profiles of each building prototype, and investigates the annual overall energy use, building energy use, energy-use intensity, use per unit, and use per occupant. The study analyses the relative energy use and annual energy consumption of each prototype, measuring specific design elements that can affect energy performance, such as building geometry, glazing ratio, and overshadowing. The energy consumption is then analyzed by the contribution that each building element adds to the overall energy load, concluding with a comparison that addresses if density is a potential solution for reducing energy demand.
Energy Use Intensity (EUI), measured in kWh/m2/year, is an indicator of energy efficiency; in this study, where EUI values are used to make relative comparisons between prototypes, it is defined as the Total Energy Demand of the building, as determined through simulation modeling, divided by the Gross Residential Floor Area. By using this method, we eliminate any bias from having large, unconditioned spaces, such as mechanical floors and naturally ventilated parking podiums or large public circulation spaces that have a relatively low energy demand per m2.
While building design aspirations have driven new innovations in structural steel, elevators, and curtain walls, historically little consideration was given to the rising energy consumption of these buildings. In the 1950s and 1960s, energy costs were low and many buildings used heat-by-light systems. The higher glazing ratios of the first full single-glazed curtain walls provided much less solar protection and thermal insulation than buildings with other types of envelopes—and they often lacked natural ventilation. The energy embargo of the late 1970s exposed these inefficient systems. Designers and engineers began to develop new attitudes toward the energy problem, responding with building solutions that included insulated glazing units, Low-E coatings, and integrating shading elements.
Today increasing fossil fuel costs, and a greater awareness of the effects that C02 has on the environment, have shifted the world’s attention to improving energy efficiency and developing alternative energy sources. Pressure is now being placed on the architectural and engineering world, and with good reason: global energy consumption in 2008 totaled 147,875 terawatt hours (TWh) or 504.7 quadrillion Btu (quads), as reported in the 2011 International Energy Outlook (published by the US EIA) and accounted for 30.2 billion metric tons of CO2, with over 10% of this global energy consumption associated with residential buildings.
Transport
This chapter is a detailed discussion of different types of transportation networks as they correlate to the different density prototypes that are included in the study, along with the benefits and challenges related to each. Transportation is the second largest contributor of carbon emissions in the United States, at 28.5% of total emissions (EPA, 2018), and in Europe at 33% with 72% of that being from road transportation (Papadimitriou et. al., 2013). A building or community can be highly energy efficient but can still have a significant negative environmental impact because of the lack of an adequate transportation network. A development can be planned and designed as the ideal live-work community, but if it lacks connectivity, the benefits of living there are minimal.
Some of the world’s most daunting problems are linked to transportation patterns and excess car use, in terms of travel times, congestion, and accessibility to affordable and convenient transportation. When an urban population reaches a certain density threshold, a well-operated mass transit system is not just convenient, it is necessary to avoid traffic congestion and consequently excessive commute times. But in many urban environments, it can be viewed as an inefficient option that is expensive to operate and maintain or a mode of transportation only used by those who either don’t own or are unable to drive a car.
Carbon
This chapter examines the lifecycle carbon dioxide emissions of each prototypical community. Lifecycle emissions are associated with the embodied carbon of the materials that are used in the construction of the building, the associated infrastructure of the building, and the operation of the building. Only the major components of the buildings are factored in the embodied carbon calculations, including reinforcement and structural steel, concrete, exterior wall materials, windows, and insulation. It does not include any maintenance or end of life deconstruction or demolition factors.
Each 2,000 unit community has a utilities and infrastructure network that was designed to service the needs of all the units, including roads, sidewalks, roadside green areas, driveways, and utilities pipes networks, which includes domestic fresh water, fire services hydrant networks, waste water, and storm water. Electrical and telecommunications infrastructure was not included in the calculations.
To calculate operational emissions, a grid emissions factor of 0.564 kg CO2/kWh was used for electricity, as reported in the US EPA eGrid database. 5.31 kg CO2/therm was used for natural gas, as established by the EPA. Materials emissions factors were obtained from a number of different sources including the University of Bath ICE (Inventory of Carbon & Energy) and various manufacturing societies and associations. In the calculations, no consideration was given to sourcing materials locally, the emissions associated with delivering materials from factory to site, or for the construction process.
Our study is not intended to be the definitive lifecycle carbon study for each typology, as that would require detailed design, product selection, and site specific product Life Cycle Analysis. It is intended to provide a relative comparison between the prototypical communities while identifying components or aspects of the 2,000 unit communities that should be focused upon in order to reduce the overall carbon footprint.
